Loads Platform / DXX, Eurowag
A freight marketplace that does not wait for anyone to post a load.
We ran product management on it.
At a glance.
- Client
- Eurowag.
- Product
- Loads Platform, internally DXX. A freight marketplace that generates offers from carrier telematics rather than waiting for a posted load.
- Our role
- Product management.
- Period
- Through 2023, across sixteen two-week sprints from February to October.
- What we owned
- Six of the fourteen key results in that year's objectives.
- What changed
- No published metric exists. The pilot documentation records what was built and records no measured outcome.
What the product is.
European road freight runs on phone calls and spreadsheets. A shipper needs a load moved, a carrier has a truck going that way, and finding each other is somebody's afternoon.
DXX was built to be the clearing house in the middle: match the market geographically and in time, then carry the workflow all the way to execution, payment included.
It does not wait for a human to post anything.
It reads carrier telematics directly, the vehicle specification, where it is and when it is free, and generates the offer itself.
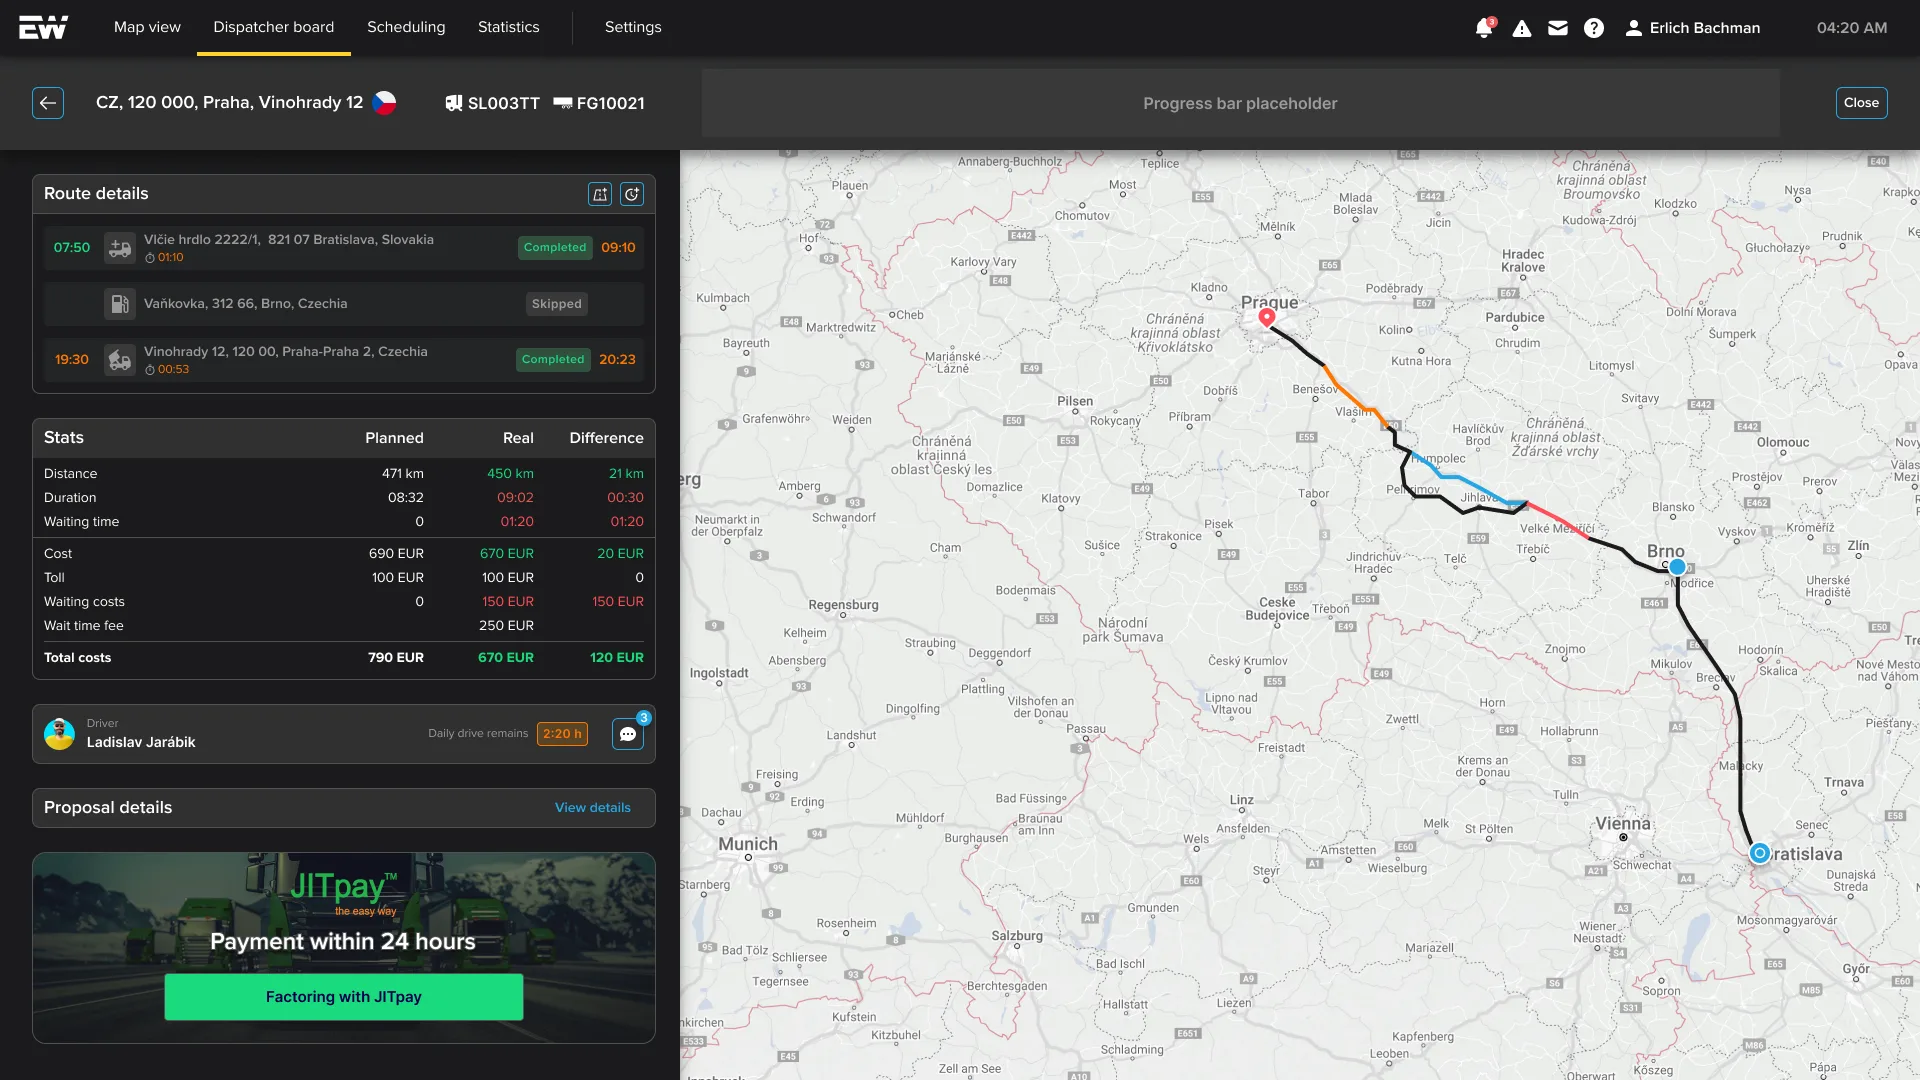
An order and an offer converge into a proposal that is streamed to both sides in real time, matched on up to 60 fields across a seven-day horizon.
The matching state machine. An order, which is what a shipper needs moved, and an offer, which the platform generates from carrier telematics rather than waiting for a human to post it, converge into a proposal. The proposal is streamed to both sides in real time and matched on up to 60 fields across a seven-day horizon. A proposal becomes a transport, and the workflow carries on to execution and payment.
A state machine, not a load board. Nothing in it waits for anyone to post a load.
Three sides had to be served at once:
- Carriers.
- Shippers.
- Consignees receiving the goods.
Why it is hard.
Start with the economics.
A real worked example from the cost model: a 2,568 kilometer transport costs 2,251 euros to run and was offered at 2,400. The carrier's profit on crossing most of a continent is about 149 euros, a margin of roughly 6 percent.
One worked example from the cost model, on a shared scale of 0 to 2,400 euros. The transport was offered at 2,400 euros. It costs 2,251 euros to run. What is left for the carrier is about 149 euros, a margin of roughly 6 percent, on a 2,568 kilometer transport.
One worked example from the cost model, not an average. Every figure in it is stated in the paragraph above.
That single number governs the entire product. At a 6 percent margin, one bad match does not reduce someone's profit, it removes it. A matching engine that is approximately right is worse than useless.
Then add the market.
- Between 20 and 40 percent of carrier kilometers run empty.
- Small carriers, under ten trucks, spend seven to eight hours a day online hunting for loads.
- The inefficiency is enormous and everyone already knows it, so the problem is not discovery, it is trust.
And trust is exactly what the research found.
Across every carrier size, only three pains rated critical in all segments:
- Whether the price is fair.
- Whether it can be negotiated.
- Whether the load is real at all. Fake loads.
Three sides, opposed incentives, six percent margins, and a trust problem. That is the brief.
The empty-running range is a Eurostat-footnoted market figure. It describes the industry, not anything FAMANEO measured.
What we were hired to do.
We ran product management on Loads.
What we shipped.
- The Ringil pilot, end to end.
- Five APIs: shipment, proposal, negotiation, transport contract and real-time visibility.
- The carrier experience, and the dispatch board design.
- A six-stage model of the transport life cycle.
- The user stories for all three sides of the market.
What was not ours.
The alpha research was run by a research team and external agencies, not by us. We want to be clear about that, because the research is the most impressive thing on this page and our hands were not on it.
What we did with it was decide what got built.
The work.
Six months, twenty five sessions, three personas, seven countries.
Two phases of research, on the same sample.
The first phase was 16 in-depth interviews, up to two hours each, with six carriers, five shippers and five consignees across seven countries.
The second phase put a clickable prototype in front of nine of them, three per persona, through four scenarios.
Everyone in phase two came from the phase one sample, so the same small, mid and large carriers carried through both.
Twenty one hypotheses went in.
The useful part is the ones that died.
Four were invalidated in every single segment. The clearest was in-transit visibility, which the roadmap had treated as a given.
We cancelled a visibility platform and our client never noticed. They never look at the data.
That is a feature, a team, and a quarter, saved by asking twenty five people first.
What changed.
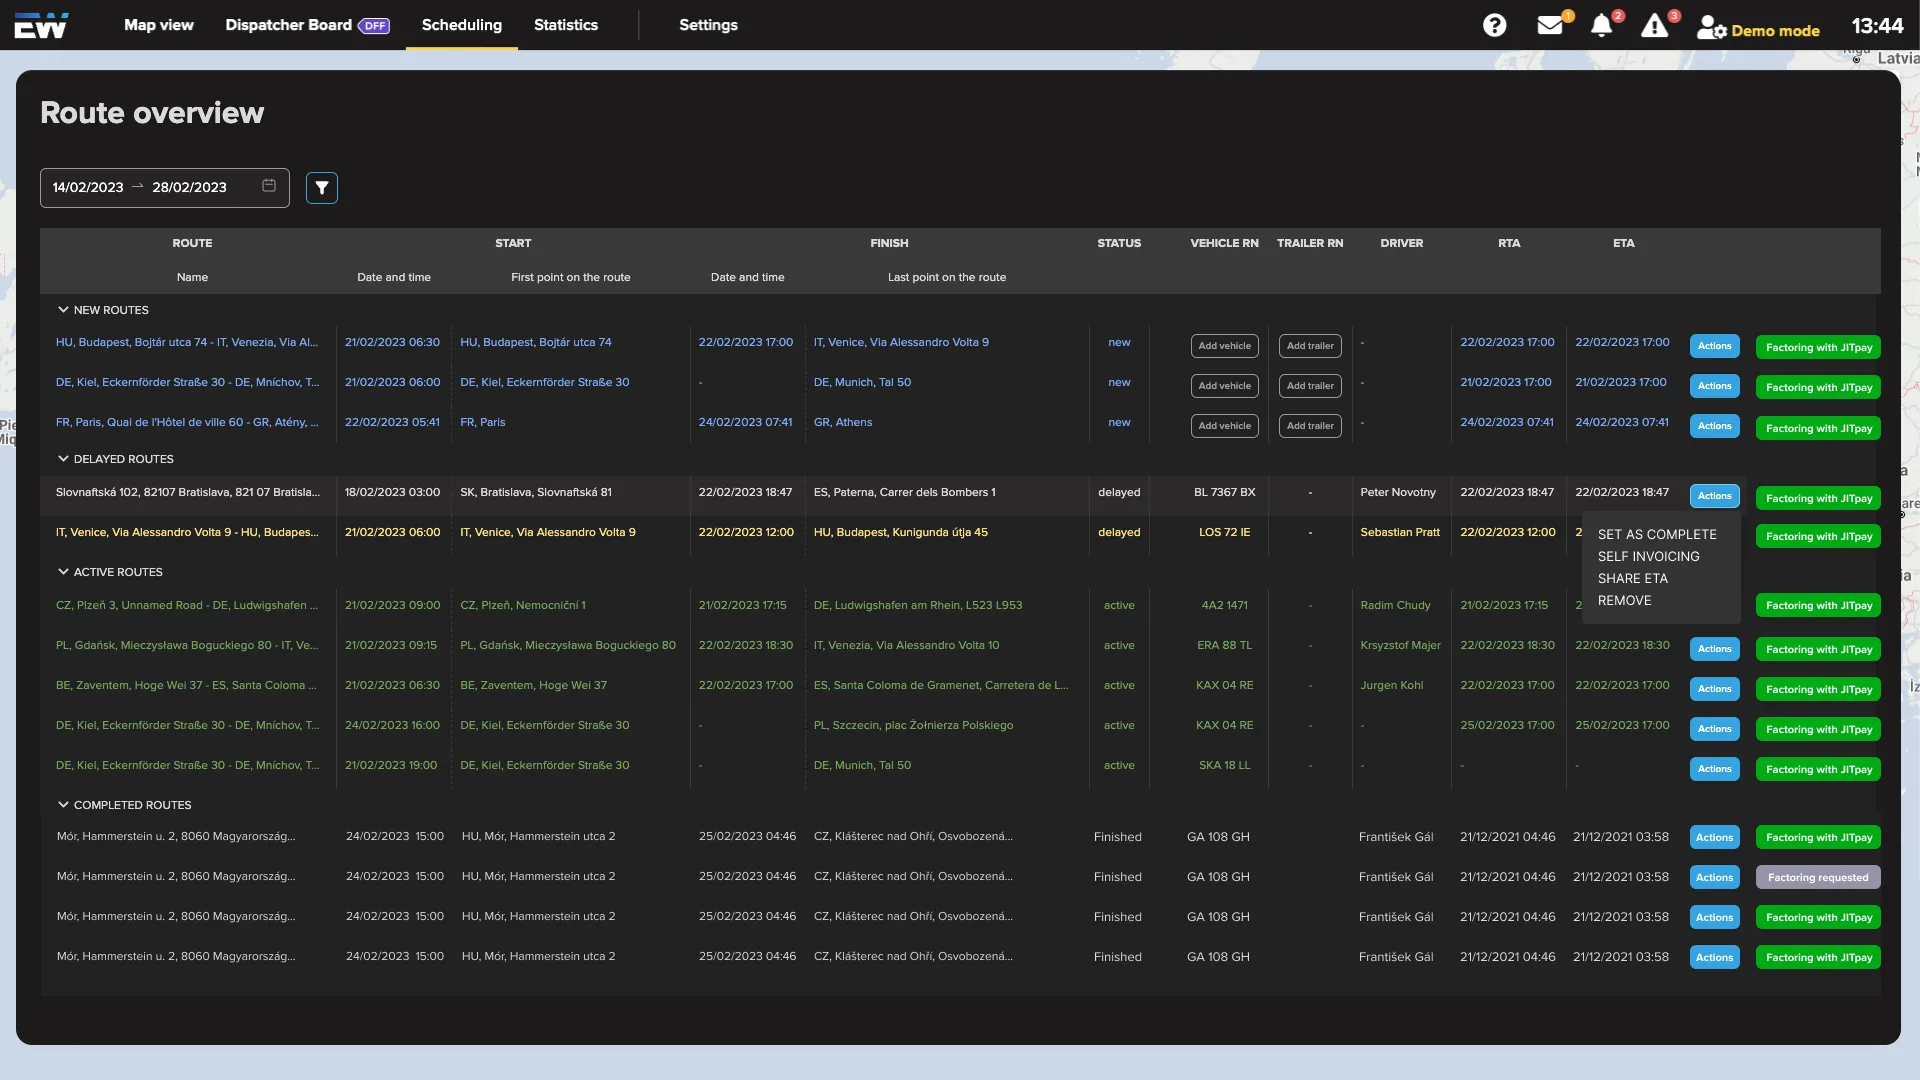
The research fed a pain map, the pain map fed a customer journey, and the journey fed a production MVP that went into a pilot with two carriers and two shippers in mid 2023.
We are not going to give you a number here. The pilot documentation records what was built and what it integrated with, and it records no measured outcome. If a result lands later, this page will say so.
What you can take from this.
Twenty five conversations killed four features before they were built. On a product with six percent margins, that is the whole return on doing discovery properly.
That is the work we productize as Which Users Drive Your Product.
Book a 30-minute call.
We will tell you which of your assumptions is worth testing before you build against it, and whether we are the right people to test it. No pitch deck.
or email hello@famaneo.com