Road Lords
A free truck navigation app that European drivers actually keep.
Sygic hired us to run product and growth on it.
At a glance.
- Client
- Sygic.
- Product
- Road Lords, free truck navigation for professional drivers, with a dispatcher console behind it.
- Our role
- Product management for the driver app.
- Period
- September 2021 to early 2023, first as an employee and then as a contractor.
- What we owned
- The roadmap, the KPI tree and the segmentation behind it, the A/B testing program, monetization and pricing.
- What changed
- Day-30 keep-rate rose 20.3 points. First-day keep-rate rose 16.7 points.
All three are public. Open the Play Store listing and check them.
Google Play Console figures for the Road Lords property, as at July 2023. They establish the scale of the product the work was done on, and they do not, on their own, attribute that growth to FAMANEO.
What Road Lords is.
Road Lords is truck navigation for professional drivers, and it is free.
What a driver gets.
- Truck-aware routing. Weight, height, class, dangerous goods: it routes you only on roads that take that.
- Environmental zones. It knows which ones will turn you away.
- Three truck profiles. Switching vehicles does not mean re-teaching the app.
- Offline maps for 48 countries. Turkey included, so it keeps working across a border with no signal.
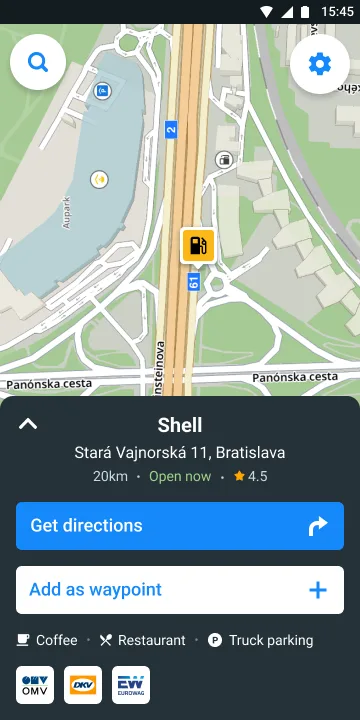
- Parking, and what is at it. Space, electricity, water, AdBlue, security. Those decide where a driver stops.
- Driver reports. Closures, speed cameras and cargo theft, passed between drivers as they go.
Two sides, and an unglamorous way in.
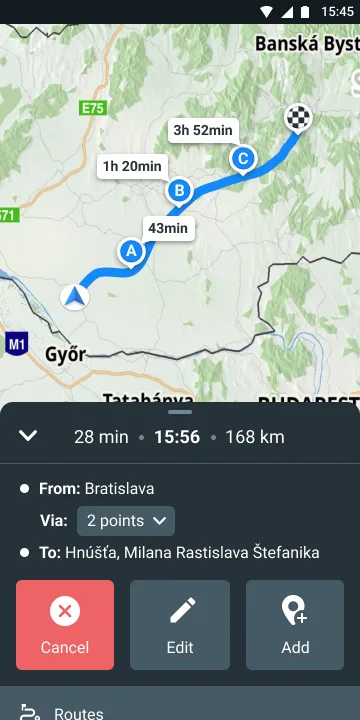
Drivers get the app. Dispatchers get a console: truck routing, tolls across Europe, live fleet tracking, and a planned transport pushed straight into the driver's phone.
A dispatcher adds a driver by sending a WhatsApp invitation. That is not a shortcut, it is the correct answer: a meaningful share of drivers in this market are on feature phones, and the carriers running fewer than ten trucks have no IT department.
Between them, 350,000 fuel stations and 500,000 parking places. Google lists the app next to TomTom.
Why it is hard.
Consumer navigation forgives a wrong turn. Truck navigation does not.
Four constraints.
- A wrong route is a bridge strike. A 4 meter vehicle sent under a 3.5 meter bridge is not a bad recommendation.
- Every rule changes at every border. Height, weight, axle load, dangerous-goods class and environmental zones each change which road is correct, and the map holds all of it offline across 48 countries.
- The user is driving while using it. The interaction budget is close to zero, and getting it wrong is a safety problem, not a bounce.
- A professional gives a tool one chance. Waste their time on a Tuesday and it is gone by Wednesday, and no acquisition spend buys that back.
That last constraint is the one that decides the product.
When the app is free and the users are professionals, growth cannot be bought. It has to come from the product being good enough to keep people, which makes retention the entire game.
What we were hired to do.
We ran product management for the Road Lords driver app, reporting to Sergio G. Barguilla, the product director.
What we owned.
- The roadmap: four initiatives and sixteen epics.
- The KPI tree, and the segmentation model behind it.
- The A/B testing program.
- Monetization and pricing.
- The GDPR consent specification.
- Hiring for UX.
What we did not own.
Not the core technology, and not the navigation SDK. That was a separate organization Road Lords depended on and did not control, and release trains were blocked by it more than once.
We are precise about that, because a product manager who claims the whole stack was not close enough to notice the edges.
The work.
First, we changed what we were counting.
Most navigation products count sessions. That is the wrong unit for a truck.
We rewrote the KPI tree: a Daily Active Driver became a device that had actually moved, and users were segmented by distance driven in the last thirty days, not by how often they opened the app.
That made an uncomfortable fact visible. Truck drivers use navigation for about a quarter of their trips, because they already know the roads they run.
So the growth question was never “how do we get more drivers”, it was “why would a driver open this when he is not lost”.
Then we built the instrument.
Events into Firebase, through to BigQuery, and four standing report suites:
- Rollout and crash rate.
- Community content.
- Driving statistics.
- Uninstalls.
Before that, nobody could answer a retention question without asking an engineer.
Then we found where the users were going.
Nearly 44 percent of new users never reached the map. Not “churned eventually”. Never got to the product at all.
Eleven percent of everyone who installed the app deleted it inside the first hour.
The first run asked for a license agreement, a vehicle type and truck settings. Those three screens were losing 16 percent, 17.4 percent and 9 percent.
The first run, from install to the map. Three screens stood in between. The license agreement lost 16 percent, the vehicle type screen lost 17.4 percent, and the truck settings screen lost 9 percent. Measured over the whole first run, nearly 44 percent of new users never reached the map at all.
Each bar is the share lost on that screen. The bar underneath is measured over the whole first run, so it is not the sum of the three.
Then we shipped against it, and measured whether it worked.
A standing A/B program ran on:
- The first-run flow, with and without the wizard.
- The map loader.
- The search hint.
- The subscription and monetization flow.
- Price elasticity.
- A seven-day free trial.
Alongside it the product kept shipping:
- A simplified yearly subscription.
- A redesigned place detail, so drivers could crowdsource truck-grade information about parking and fuel.
- In-app booking for secure parking.
- Advanced lane assist.
- A modal queue capping how many times the product could interrupt a driver in one session.
What changed.
Day-30 keep-rate rose 20.3 points. First-day keep-rate rose 16.7 points.
Two bars on a shared scale of 0 to 25 percentage points, showing the change in keep-rate. First-day keep-rate rose 16.7 percentage points. Day-30 keep-rate rose 20.3 percentage points.
These are changes in keep-rate, measured in percentage points, not the keep-rates themselves. The absolute rates are the client's, and they are not published here.
And underneath them.
On a free product sold to professionals, the keep-rates are the numbers that decide whether anything else matters, which is why they lead here.
We did not build this alone. We set the metrics and the operating cadence, and Sygic's in-house team built the product against them.
What you can take from this.
The reason the keep-rates moved is not a growth tactic. It is that the team started measuring the right thing every week, and shipped against it.
That is the work we productize as Run Your Product for Growth.
Book a 30-minute call.
We will tell you whether your product has a retention gap you can act on, and whether we are the right people to close it. No pitch deck.
or email hello@famaneo.com